


Oklahoma’s tax revenue for January rose nearly 8%, but State Treasurer Todd Russ says unfortunately, gross production tax revenue from oil and gas in the state fell more than 12%.
All tax sources total $1.51 billion for January, up $107 million, or 7.6 percent, when comparing to January of last year. Revenue from the state’s Gross Production Tax or “GPT” dropped to $12.8 million, down by 12.4 percent, when comparing to last month.
Declining tax revenue from oil and gas production, continues to push total gross receipts revenues down while all other categories are up for the month.
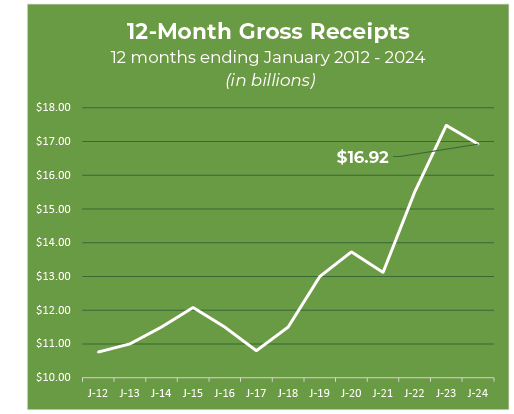
Total receipts for the last 12 months total $16.92 billion, a decrease of $555 million, or 3.2 percent, when comparing revenue from the previous year.
Oklahoma Business Conditions Index: Sank below growth neurtal at 48.7, compared to 50.5 last month.
• Numbers above 50 indicate the expectation of economic expansion over the next three to
six months, but it should be noted that the index has been very volatile in recent months.
Oklahoma Unemployment, U.S. Bureau of Labor Statistics: Small uptick of 3.4% last month, up from 0.1%.
• The national unemployment rate remained at 3.7% for the last two months.
Consumer Price Index, U.S. Bureau of Labor Statistics: Annual inflation rate rose slightly to 3.4% last month.
• Energy prices decreased 2.0% in 2023, after increasing 7.3% in 2022.
• Prices for four of the six major food at home groups increased from 2022 to 2023.
• Costs for new vehicles increased 1.0% in 2023, compared with a 5.9% increase in 2022.
• Prices for medical care rose 0.5% in 2023, following an increase of 4.0% in 2022.
12-Month Period End Comparison
Gross receipts total $16.92 billion, down $555 million or 3.2 percent versus 2023 total.
• Combined individual income tax and
corporate income tax of $6.07 billion, up
$37.1 million or 0.6 percent.
o Individual tax of $5.12 billion, up $80.2
million or 1.6 percent.
o Corporate tax of $957.3 million, down
$43.1 million or 4.3 percent.
• Combined sales tax and use tax–including
city and county remittances–of $7.13 billion,
up $223.3 million or 3.2 percent.
o Sales tax of $5.97 billion, up $128.7
million or 2.2 percent.
o Use tax, received on out-of-state and
internet purchases, of $1.15 billion, up
$94.5 million or 8.9 percent.
• Oil and gas gross production tax of $1.23 billion, down $770.8 million or 38.7 percent.
• Motor vehicle tax of $865.7 million, down $10 million or 1.1 percent.
• Other sources, includes more than 70 revenue streams, of $1.63 billion, down $34.8 million or 2.1 percent.
Monthly Comparison
Gross receipts total $1.51 billion, down $34.5 million or 2.2 percent versus January 2023.
• Income tax of $590.8 million, up $40.3
million or 7.3 percent.
o Individual tax of $513.5 million, up $31.3
million or 6.5 percent.
o Corporate tax of $77.2 million, up $9.1
million or 13.3 percent.
• Sales and use tax of $626.1 million, down
$3.3 million or 0.5 percent.
o Sales tax of $504.7 million, down $10.5
million or 2.0 percent.
o Use tax of $121.4 million, up $7.2 million
or 6.3 percent.
• Gross production tax of $90.1 million, down
$63 million or 41.2 percent.
• Motor vehicle tax of $66.1 million down $8.0 million or 10.8 percent.
• Other sources of $141.3 million, down $34.5 million or 2.2 percent.
|
||
Oklahoma Business Conditions Index: Sank below growth neutral at 48.7, compared to 50.5 last month.
Oklahoma Unemployment, U.S. Bureau of Labor Statistics: Small uptick of 3.4% last month, up from 0.1%.
Consumer Price Index, U.S. Bureau of Labor Statistics: Annual inflation rate rose slightly to 3.4% last month.
|