

As the nation’s gasoline prices approach $4 a gallon and the average in Oklahoma is at $3.25 per gallon, the prices still are not what motorists paid four years ago.
While critics of the war against Iran complain it led to high fuel prices in the states, a historical review showed gasoline prices were nearly $5 a gallon in June of 2022, months after President Joe Biden had taken office. The average price, according to the U.S. Energy Information Administration was $4.92 per gallon.
For five months during 2022, Americans paid more than $4 a gallon for gasoline. The U.S. average price in 2022 was $4.22 in March; $4.10 in April; $4.44 in May; $4.92 in June; and $4.55 in July. For the remaining months of that year, prices fell to under $4 per gallon.
It’s doubtful the U.S. will ever see the gasoline prices paid by motorists in the 70s, 80s and 90s. Prices started climbing amid the 1979 energy crisis and continue their climb in the 80s, before undergoing a long-steady decline. Prior to the ’79 energy crisis, motorists paid 62 cents a gallon in 1978 and 63 cents in 1979. Prices jumped to 86 cents a gallon in 1980 and $1.19 in 1981.
A global oil glut in the mid 1980s saw prices fall, reaching 86 cents a gallon in 1986.
Here is the 1980 price swing:
1980—$1.19 to $1.25
1981—$1.31 to $1.35
1982—$.122 to $1.28
1983—$1.16 to $1.23
1984—$1.13 to $1.20
1985—$1.12 to $1.20
1986—$0.86 to $0.93
1987—$0.90 to $0.96
1988—$0.90 to $0.96
1989—$1.00 to $1.06
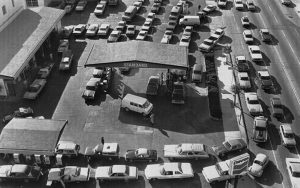
The 1979 energy crisis was actually the second such gasoline crunch to hit the nation. To those who recall, long lines of drivers stretched around service stations as gasoline rationing and shortages were reported during the Arab oil embargo.

It forced then President Richard Nixon to implement the 55 mph national speed limit through the Emergency Highway Energy Conservation Act to combat severe fuel shortages. By forcing drivers to travel at more fuel-efficient speeds, the government aimed to cut oil consumption, reducing speeds nationwide through federal funding threats.
Then came the 1979 energy crisis, caused in part by the overthrow of Shah Mohammad Reza Pahlavi in Iran. It was the started of the Iranian Revolution and Iranian oil output declined by 4.8 million barrels per day (7 percent of world production at the time) by January 1979.
Oil prices rose and so did gasoline prices, In the 1990s, gasoline reached $1.14 a gallon in June of 1991 but was only $1 per gallon in September of 1998. By October of 1004, gasoline was up to $2 a gallon and the first time the U.S. saw $3 gasoline was in May of 2007 when it averaged $3.14 per gallon.
It was in 2011 when gasoline averaged $3 or more every month of the year.
As for crude oil prices,
- In June 2008, oil peaked at a nominal price of $126.33 (inflation-adjusted price of $186.22)
- Oil prices fell to the ridiculously low COVID-induced glut price of $11.18 in April 2020 (inflation-adjusted $14.07).
- The average inflation-adjusted price for crude oil since 1946 is $58.07, which is still about one-third of the 2008 price.
- The average inflation-adjusted price since 1980 is higher at $71.25
- The average inflation-adjusted price since 2000 is even higher at $79.58
Cushing, OK WTI Spot Price FOB (Dollars per Barrel)
| Decade | Year-0 | Year-1 | Year-2 | Year-3 | Year-4 | Year-5 | Year-6 | Year-7 | Year-8 | Year-9 |
|---|---|---|---|---|---|---|---|---|---|---|
| 1980’s | 15.05 | 19.20 | 15.97 | 19.64 | ||||||
| 1990’s | 24.53 | 21.54 | 20.58 | 18.43 | 17.20 | 18.43 | 22.12 | 20.61 | 14.42 | 19.34 |
| 2000’s | 30.38 | 25.98 | 26.18 | 31.08 | 41.51 | 56.64 | 66.05 | 72.34 | 99.67 | 61.95 |
| 2010’s | 79.48 | 94.88 | 94.05 | 97.98 | 93.17 | 48.66 | 43.29 | 50.80 | 65.23 | 56.99 |
| 2020’s | 39.16 | 68.13 | 94.90 | 77.58 | 76.63 | 65.39 |
| Europe Brent Spot Price FOB (Dollars per Barrel) |
| Year | Jan | Feb | Mar | Apr | May | Jun | Jul | Aug | Sep | Oct | Nov | Dec |
|---|---|---|---|---|---|---|---|---|---|---|---|---|
| 1987 | 18.58 | 18.86 | 19.86 | 18.98 | 18.31 | 18.76 | 17.78 | 17.05 | ||||
| 1988 | 16.75 | 15.73 | 14.73 | 16.60 | 16.31 | 15.54 | 14.91 | 14.89 | 13.18 | 12.41 | 13.02 | 15.31 |
| 1989 | 17.17 | 16.89 | 18.70 | 20.32 | 18.63 | 17.67 | 17.62 | 16.77 | 17.77 | 18.91 | 18.73 | 19.84 |
| 1990 | 21.25 | 19.81 | 18.39 | 16.61 | 16.35 | 15.10 | 17.17 | 27.17 | 34.90 | 36.02 | 33.07 | 28.27 |
| 1991 | 23.57 | 19.54 | 19.08 | 19.18 | 19.19 | 18.17 | 19.40 | 19.77 | 20.50 | 22.21 | 21.11 | 18.41 |
| 1992 | 18.16 | 18.05 | 17.63 | 18.92 | 19.89 | 21.16 | 20.24 | 19.74 | 20.27 | 20.26 | 19.21 | 18.14 |
| 1993 | 17.39 | 18.47 | 18.79 | 18.67 | 18.51 | 17.65 | 16.78 | 16.70 | 16.01 | 16.61 | 15.20 | 13.73 |
| 1994 | 14.29 | 13.80 | 13.82 | 15.23 | 16.19 | 16.76 | 17.60 | 16.89 | 15.90 | 16.49 | 17.19 | 15.93 |
| 1995 | 16.55 | 17.11 | 17.01 | 18.65 | 18.35 | 17.31 | 15.85 | 16.10 | 16.70 | 16.11 | 16.86 | 17.93 |
| 1996 | 17.85 | 18.00 | 19.85 | 20.90 | 19.15 | 18.46 | 19.57 | 20.51 | 22.63 | 24.16 | 22.76 | 23.78 |
| 1997 | 23.54 | 20.85 | 19.13 | 17.56 | 19.02 | 17.58 | 18.46 | 18.60 | 18.46 | 19.87 | 19.17 | 17.18 |
| 1998 | 15.19 | 14.07 | 13.10 | 13.53 | 14.36 | 12.21 | 12.08 | 11.91 | 13.34 | 12.70 | 11.04 | 9.82 |
| 1999 | 11.11 | 10.27 | 12.51 | 15.29 | 15.23 | 15.86 | 19.08 | 20.22 | 22.54 | 22.00 | 24.58 | 25.47 |
| 2000 | 25.51 | 27.78 | 27.49 | 22.76 | 27.74 | 29.80 | 28.68 | 30.20 | 33.14 | 30.96 | 32.55 | 25.66 |
| 2001 | 25.62 | 27.50 | 24.50 | 25.66 | 28.31 | 27.85 | 24.61 | 25.68 | 25.62 | 20.54 | 18.80 | 18.71 |
| 2002 | 19.42 | 20.28 | 23.70 | 25.73 | 25.35 | 24.08 | 25.74 | 26.65 | 28.40 | 27.54 | 24.34 | 28.33 |
| 2003 | 31.18 | 32.77 | 30.61 | 25.00 | 25.86 | 27.65 | 28.35 | 29.89 | 27.11 | 29.61 | 28.75 | 29.81 |
| 2004 | 31.28 | 30.86 | 33.63 | 33.59 | 37.57 | 35.18 | 38.22 | 42.74 | 43.20 | 49.78 | 43.11 | 39.60 |
| 2005 | 44.51 | 45.48 | 53.10 | 51.88 | 48.65 | 54.35 | 57.52 | 63.98 | 62.91 | 58.54 | 55.24 | 56.86 |
| 2006 | 62.99 | 60.21 | 62.06 | 70.26 | 69.78 | 68.56 | 73.67 | 73.23 | 61.96 | 57.81 | 58.76 | 62.47 |
| 2007 | 53.68 | 57.56 | 62.05 | 67.49 | 67.21 | 71.05 | 76.93 | 70.76 | 77.17 | 82.34 | 92.41 | 90.93 |
| 2008 | 92.18 | 94.99 | 103.64 | 109.07 | 122.80 | 132.32 | 132.72 | 113.24 | 97.23 | 71.58 | 52.45 | 39.95 |
| 2009 | 43.44 | 43.32 | 46.54 | 50.18 | 57.30 | 68.61 | 64.44 | 72.51 | 67.65 | 72.77 | 76.66 | 74.46 |
| 2010 | 76.17 | 73.75 | 78.83 | 84.82 | 75.95 | 74.76 | 75.58 | 77.04 | 77.84 | 82.67 | 85.28 | 91.45 |
| 2011 | 96.52 | 103.72 | 114.64 | 123.26 | 114.99 | 113.83 | 116.97 | 110.22 | 112.83 | 109.55 | 110.77 | 107.87 |
| 2012 | 110.69 | 119.33 | 125.45 | 119.75 | 110.34 | 95.16 | 102.62 | 113.36 | 112.86 | 111.71 | 109.06 | 109.49 |
| 2013 | 112.96 | 116.05 | 108.47 | 102.25 | 102.56 | 102.92 | 107.93 | 111.28 | 111.60 | 109.08 | 107.79 | 110.76 |
| 2014 | 108.12 | 108.90 | 107.48 | 107.76 | 109.54 | 111.80 | 106.77 | 101.61 | 97.09 | 87.43 | 79.44 | 62.34 |
| 2015 | 47.76 | 58.10 | 55.89 | 59.52 | 64.08 | 61.48 | 56.56 | 46.52 | 47.62 | 48.43 | 44.27 | 38.01 |
| 2016 | 30.70 | 32.18 | 38.21 | 41.58 | 46.74 | 48.25 | 44.95 | 45.84 | 46.57 | 49.52 | 44.73 | 53.31 |
| 2017 | 54.58 | 54.87 | 51.59 | 52.31 | 50.33 | 46.37 | 48.48 | 51.70 | 56.15 | 57.51 | 62.71 | 64.37 |
| 2018 | 69.08 | 65.32 | 66.02 | 72.11 | 76.98 | 74.41 | 74.25 | 72.53 | 78.89 | 81.03 | 64.75 | 57.36 |
| 2019 | 59.41 | 63.96 | 66.14 | 71.23 | 71.32 | 64.22 | 63.92 | 59.04 | 62.83 | 59.71 | 63.21 | 67.31 |
| 2020 | 63.65 | 55.66 | 32.01 | 18.38 | 29.38 | 40.27 | 43.24 | 44.74 | 40.91 | 40.19 | 42.69 | 49.99 |
| 2021 | 54.77 | 62.28 | 65.41 | 64.81 | 68.53 | 73.16 | 75.17 | 70.75 | 74.49 | 83.54 | 81.05 | 74.17 |
| 2022 | 86.51 | 97.13 | 117.25 | 104.58 | 113.34 | 122.71 | 111.93 | 100.45 | 89.76 | 93.33 | 91.42 | 80.92 |
| 2023 | 82.50 | 82.59 | 78.43 | 84.64 | 75.47 | 74.84 | 80.11 | 86.15 | 93.72 | 90.60 | 82.94 | 77.63 |
| 2024 | 80.12 | 83.48 | 85.41 | 89.94 | 81.75 | 82.25 | 85.15 | 80.36 | 74.02 | 75.63 | 74.35 | 73.86 |
| 2025 | 79.27 | 75.44 | 72.73 | 68.13 | 64.45 | 71.44 | 71.04 | 67.87 | 67.99 | 64.54 | 63.80 | 62.54 |
| 2026 | 66.60 | 70.89 | ||||||||||
| Decade | Year-0 | Year-1 | Year-2 | Year-3 | Year-4 | Year-5 | Year-6 | Year-7 | Year-8 | Year-9 |
|---|---|---|---|---|---|---|---|---|---|---|
| 1980’s | 15.05 | 19.20 | 15.97 | 19.64 | ||||||
| 1990’s | 24.53 | 21.54 | 20.58 | 18.43 | 17.20 | 18.43 | 22.12 | 20.61 | 14.42 | 19.34 |
| 2000’s | 30.38 | 25.98 | 26.18 | 31.08 | 41.51 | 56.64 | 66.05 | 72.34 | 99.67 | 61.95 |
| 2010’s | 79.48 | 94.88 | 94.05 | 97.98 | 93.17 | 48.66 | 43.29 | 50.80 | 65.23 | 56.99 |
| 2020’s | 39.16 | 68.13 | 94.90 | 77.58 | 76.63 | 65.39 |