
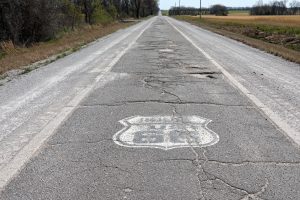
A report by Consumer Affairs shows Oklahoma’s roads and highways actually were in worse condition from 2025-to-2026 than they were a year ago.
New Mexico is categorized as having the “worst roads” while Oklahoma is fifth worst in the country. The report stated Oklahoma fell from No. 34 in the 2025 analysis and “conditions worsened across both urban and rural roads” and nearly a quarter of the state’s rural roads are in “poor condition.”
Oklahomans may be frustrated to learn that they’re spending a pretty penny for this rough ride. According to a 2025 TRIP analysis, deteriorated roads cost its drivers $2.4 billion a year in additional vehicle operating costs, $2.4 billion in lost time and wasted fuel due to congestion and $1.5 billion in traffic crashes (a total of $6.3 billion a year).
And road surface quality isn’t the only problem. Oklahoma ranks in the worst 10 states for traffic deaths.
“When roads deteriorate, drivers have less margin for error,” said Archie Scott III, the founder and CEO of Asynt Solutions, a transportation infrastructure solutions company. “Poorly maintained surfaces, crumbling infrastructure and outdated safety hardware increase the likelihood and severity of crashes, especially as vehicles get heavier and traffic volumes rise.”
Key metrics:
- Percentage of urban roads in poor condition: 37.5%
- Percentage of rural roads in poor condition: 24.8% (fifth worst)
- Traffic fatalities per 100M miles traveled: 1.57 (eighth worst)
1. New Mexico
For the second year in a row, New Mexico takes home the title of “worst roads in the country.” Nearly half of New Mexico’s urban roads and a third of its rural roads are in poor condition, and it’s among the 10 worst states for rate of traffic fatalities.
The crumbling conditions facing New Mexico’s roads didn’t happen overnight. The New Mexico Department of Transportation (NMDOT) reported in August 2025 that the state needs $5.6 billion for unfunded transportation projects. Meanwhile, New Mexico has the third-lowest gas tax rate in the country — largely because it hasn’t raised its gas tax in more than 30 years, which has severely constricted the flow of revenue for road maintenance projects.
But rough roads aren’t just about the state’s coffers; they also impact drivers’ wallets. Recent analysis from the national transportation research group TRIP found that deteriorating roads cost the average New Mexico resident $1,075 a year in additional vehicle operating costs.
The silver lining? After years of poor performance, legislative leaders in the Land of Enchantment are redoubling their efforts to tackle the issue. In September 2025, NMDOT announced it had awarded $100.4 million to more than 70 projects across the state. That’s more than double the investment of the previous fiscal year.
Key metrics:
- Percentage of urban roads in poor condition: 49.8% (sixth worst)
- Percentage of rural roads in poor condition: 31.2% (second worst)
- Traffic fatalities per 100M miles traveled: 1.55 (ninth worst)
2. Mississippi
Mississippi has the second-worst roads overall, ranking just behind New Mexico for the second year in a row. Almost half of Mississippi’s urban roads and more than a quarter of all rural roads are in poor condition.
Mississippi scores the worst in America for traffic fatalities, with a rate that’s 42% higher than the national average. This is particularly notable because Mississippi motorists aren’t known for aggressive or careless driving behaviors (the state ranks in the bottom three for road rage).
State spending doesn’t provide a simple explanation for Mississippi’s poor road quality, either. In most cases, “(the) top states with the best (road) conditions are the ones that invest heavily and are always allocating their funds strategically before deterioration happens,” said Bruce Shields, founder and president of ABS Tag & Title, which assists fleets and dealers nationwide. But Mississippi is one of just a handful of states that is not anticipating a gap in roadway funding, so its poor road conditions can’t necessarily be blamed on a budget shortfall.
Key metrics:
- Percentage of urban roads in poor condition: 49.3% (eighth worst)
- Percentage of rural roads in poor condition: 28.2% (fourth worst)
- Traffic fatalities per 100M miles traveled: 1.79 (worst)
3. Rhode Island
Rhode Island ranks slightly worse than it did in last year’s analysis, moving up from fifth worst in 2025 to third worst in 2026. A staggering 60% of Rhode Island’s urban roads are in poor condition — the worst of any state. It ranks only slightly better when it comes to rural roads (third worst), with 29% in poor condition.
Across the country, weather and climate patterns play a meaningful role in how many roads are cracked or crumbling. Rhode Island’s infrastructure faces a perfect storm of increasingly frequent risk factors, like storm surges, floods and other severe weather events — not to mention rising sea levels and coastal erosion.
With all these challenges, only 55% of Rhode Island’s roads are in acceptable condition — the lowest rate in the nation. So what’s holding back the Ocean State from taking the worst rank overall? Rhode Island has one of the lowest traffic fatality rates in the country.
Key metrics:
- Percentage of urban roads in poor condition: 60.2% (worst)
- Percentage of rural roads in poor condition: 28.9% (third worst)
- Traffic fatalities per 100M miles traveled: 0.94 (ninth best)
4. Hawaii
Hawaii saw a slight improvement in ranking from last year, moving back one place from third worst to fourth worst. Overall, 39% of roads in Hawaii are in poor condition — a rate that’s more than double the national average (18.9%).
While the state has a small network of roads to maintain, Hawaii faces many of the same struggles that larger states do. More than half of urban roads and more than a third of rural roads in the Aloha State are in rough shape.
Fortunately, the poor quality of Hawaii’s roadways is in stark contrast with its road safety. The state has less than one traffic fatality for every 100 million miles travelled — one of the lowest rates in the nation.
Key metrics:
- Percentage of urban roads in poor condition: 51.2% (fourth worst)
- Percentage of rural roads in poor condition: 33.6% (worst)
- Traffic fatalities per 100M miles traveled: 0.89 (sixth best)
5. Oklahoma
Which states have the best road conditions?
Keep reading for a deeper dive into the states with the best roads.
1. Indiana
For the second year in a row, Indiana has the best roads in America. The state swept the road quality categories, with just 5% of urban roads and less than 2% of rural roads in poor condition. Overall, 97.4% of roads in the Hoosier State are in solid shape — the highest rate in the country.
And better roads mean more money stays in motorists’ wallets. Driving on deteriorated roads costs the average Indiana driver just $230 a year in increased fuel consumption, tire wear, vehicle depreciation and additional repairs, according to TRIP. Compare that with the average cost to drivers nationwide ($725, over three times more) or in worst-ranked New Mexico ($1,075 a year, almost five times more).
Indiana also ranks in the top third of states for fewest traffic deaths, with an average rate of just 1.05 fatalities per 100 million vehicle miles traveled.
However, impressive road quality doesn’t mean that infrastructure investment isn’t an uphill battle — even in a place as famously flat as the Hoosier State. In early January 2026, the Indiana Department of Transportation (INDOT) confirmed that it had requested permission from the Federal Highway Administration to turn Interstate 70 — a major east-west artery and key freight corridor — into a toll road.
If the plans move forward, the new income stream could prove critical for maintaining Indiana’s stellar road quality. The same week the toll road application news broke, INDOT announced that more than 300 projects would be delayed due to funding shortfalls.
Key metrics:
- Percentage of urban roads in poor condition: 4.8% (best)
- Percentage of rural roads in poor condition: 1.6% (best)
- Traffic fatalities per 100M miles traveled: 1.05
2. Minnesota
A second Midwestern state tops the list for best roads in the country: Minnesota. In the North Star State, more than 90% of urban and rural roads are in fair or good condition. This is even more impressive when you consider that it has one of the largest road networks in the U.S.
In addition to scoring second-best overall, Minnesota ranks second for fewest traffic deaths. Fatalities occur at a rate of just 0.7 per 100 million miles traveled, 44% lower than the nationwide rate.
Fortunately, the Minnesota Department of Transportation (MnDOT) appears committed to maintaining these strong stats. The agency started off 2026 with a bang, announcing that it awarded $76.2 million in funding to dozens of transportation projects across the state.
Key metrics:
- Percentage of urban roads in poor condition: 13.6% (seventh best)
- Percentage of rural roads in poor condition: 5.4%
- Traffic fatalities per 100M miles traveled: 0.7 (second best)
3. Vermont
Vermont ranks third overall for the best roads in America, with favorable scores across each of the key categories in our methodology. The state ranks sixth best for urban roads, 11th best for rural roads and 11th best for traffic deaths.
It could be tempting to assume there’s a straightforward relationship between the size of a road network and a state’s ability to maintain it. After all, the Green Mountain State has one of the smallest total lengths of public roadways in the country — meaning a lot less to manage and pay for.
However, size isn’t everything: Even states with vast networks have achieved outstanding road quality. Vermont’s road network is a drop in the bucket compared with Indiana’s and Minnesota’s. It’s also worth pointing out that the state with the smallest road network — Hawaii — ranks in the five worst states for road quality.
Unfortunately, small states aren’t exempt from funding challenges, either. While nearly 95% of Vermont’s roads are currently in acceptable shape, the state projects a transportation funding deficit for fiscal year 2027, which would threaten the state’s ability to match $163 million in federal funds.
Key metrics:
- Percentage of urban roads in poor condition: 13.5% (sixth best)
- Percentage of rural roads in poor condition: 3.1%
- Traffic fatalities per 100M miles traveled: 0.96
4. Georgia
When you think of smooth, well-maintained roads, is Georgia on your mind? If it isn’t, perhaps it should be: The Peach State ranks fourth overall for its impressive road conditions. That’s an improvement of seven places from last year’s analysis.
Georgia’s urban road conditions are especially notable. They rank second best in the nation, with nearly 93% in fair or good condition. (This may come as a surprise to anyone who’s driven in the state’s capital, Atlanta, where rampant potholes and some of the nation’s worst traffic can make for a difficult driving experience.)
Georgia also ranks in the top 10 states for its rural road conditions. Unfortunately, its roads aren’t as safe as many other states: Georgia ranks in the bottom half of states for traffic fatalities.
As Georgia’s economy and population continue to grow, experts predict that the state’s infrastructure will face greater pressure. Freight tonnage on Georgia’s highways is projected to double within 25 years, and the state’s population is expected to add nearly 2 million residents by 2050.
Key metrics:
- Percentage of urban roads in poor condition: 7.5% (second best)
- Percentage of rural roads in poor condition: 2.8% (eighth best)
- Traffic fatalities per 100M miles traveled: 1.28
5. Kansas
For the second year in a row, Kansas ranks fifth best for road conditions. More than 96% of Kansas roads are in acceptable condition, the second-highest share of all states.
Kansas has particularly high-quality rural roads: Less than 2.5% are in poor condition. But a few of those rural roads will soon be getting a facelift. In 2025, Gov. Laura Kelly announced over $26 million to modernize roads in southwest Kansas.
Experts say these kinds of investments are critical.
“For road maintenance funded through public dollars, a common issue is that upkeep is deferred because roads are still ‘working,’ even as visible cracks, potholes and crumbling pavement clearly show decline,” said Jennifer Perkins, a government industry specialist at Brightly Software, which helps local governments manage and maintain infrastructure.
“While deferred maintenance or a ‘fix it when it breaks’ mindset can help balance budgets in the short term, it typically leads to higher costs and greater safety risks down the line,” Perkins said.
Just one factor is holding the Sunflower State back from a better ranking: safety. Kansas is in the middle of the pack in rate of traffic fatalities.
Key metrics:
- Percentage of urban roads in poor condition: 10.4% (fourth best)
- Percentage of rural roads in poor condition: 2.4% (fourth best)
- Traffic fatalities per 100M miles traveled: 1.22
-
How does road quality compare by state?
Regional trends are apparent in road quality — particularly at the bottom of the list. The worst 10 ranks are dominated by Western and Southern states; there is just one Northeastern state, and no Midwestern states.
The South seems to have the most volatile road conditions, as it experienced significant ranking changes between our 2025 and 2026 analyses. States including Oklahoma, Arkansas and North Carolina rank much worse than they did last year, while Georgia and Virginia rank much better.
But the factors that contribute to road conditions can’t all be shown on a map. “Road conditions vary dramatically across the country, but the upstream causes are often the same: aging materials, increased traffic demands and infrastructure systems that weren’t designed for today’s realities,” said Scott from Asynt Solutions.
The difference between states with the best and worst roads often comes down to “life cycle thinking,” he added. “States that invest in materials and systems designed to last longer tend to stretch their infrastructure dollars further and avoid the constant cycle of repair and replacement.”
- Columns:
- 2025 rank
- 2026 rank
- Change in rank 2025-2026
- score
- Percentage of urban roads in poor condition
- Total miles of urban roads
- Percentage of rural roads in poor condition
- Total miles of rural roads
- Traffic fatalities per 100M vehicle miles traveled
-
United States – – – – 35.9% 154,949 10.4% 339,416 1.26 New Mexico 1 1 0 85.54 49.8% 1,473 31.2% 5,732 1.55 Mississippi 2 2 0 85.36 49.3% 2,259 28.2% 8,777 1.79 Rhode Island 3 5 2 80.29 60.2% 763 28.9% 227 0.94 Hawaii 4 3 −1 78.88 51.2% 558 33.6% 359 0.89 Oklahoma 5 34 29 69.05 37.5% 1,836 24.8% 11,689 1.57 Washington 6 7 1 67.11 52.4% 3,901 17.5% 4,925 1.35 Louisiana 7 4 −3 66.71 43.6% 3,210 20.9% 5,172 1.46 California 8 17 9 64.85 46% 9,260 20.3% 10,366 1.28 Arizona 9 13 4 64.75 50% 3,521 12.1% 4,893 1.73 Colorado 10 9 −1 61.20 44.1% 2,854 18% 7,025 1.32 Pennsylvania 11 15 4 61.15 43.7% 6,669 19.6% 9,014 1.21 Missouri 12 6 −6 58.86 44% 3,603 17.4% 10,611 1.23 Texas 13 10 −3 58.84 49.7% 18,638 11.4% 28,754 1.43 Wisconsin 14 8 −6 58.77 56.5% 4,387 14.8% 12,750 0.87 Alaska 15 11 −4 55.74 37.4% 516 20.7% 2,078 1.0 Connecticut 16 12 −4 54.06 41.2% 2,346 18% 578 1.0 South Carolina 17 16 −1 50.88 26% 2,510 15% 7,227 1.72 Montana 18 18 0 47.76 40.2% 598 6.9% 8,172 1.52 Illinois 19 19 0 43.12 45.4% 7,412 4.2% 13,031 1.21