


Despite the seemingly never-ending construction projects encountered by motorists on I-35 in Oklahoma, the state still ranks 36th in the nation in overall cost-effectiveness and condition according to the Annual Highway Report by Reason Foundation. This is a two-spot decline from the previous report, where Oklahoma ranked 34th.
Oklahoma ranks in the bottom half of states in all 13 of the report’s metrics. It is the only state to not have a single ranking in the top 25. Oklahoma ranks in the bottom 10 in three categories: overall fatality rate, rural arterial pavement condition, and structurally deficient bridges.
For overall fatality rate, Oklahoma’s 1.43 is 10% higher than peer states Kansas and Arkansas. For poor rural arterial pavement, Oklahoma has twice the percentage as Arkansas and four times as much as Kansas. For bridges, more than 10% of Oklahoma’s are structurally deficient—twice that of Arkansas and Kansas.
In safety and performance categories, Oklahoma ranks 45th in overall fatality rate, 41st in structurally deficient bridges, 32nd in traffic congestion, 39th in urban Interstate pavement condition, and 38th in rural Interstate pavement condition.
Oklahoma spends $88,266 per mile of state-controlled road. Oklahoma is 30th in total spending per mile and 26th in capital and bridge costs per mile.

Oklahoma’s best rankings are in capital and bridge disbursements (26th) and urban arterial pavement condition (27th).
Oklahoma’s worst rankings are in overall fatality rate (45th) and rural arterial pavement condition (43rd).
Oklahoma commuters spend 11.68 hours stuck in traffic congestion, ranking 32nd nationally.
Oklahoma’s state-controlled highway mileage makes it the 18th largest highway system in the country.
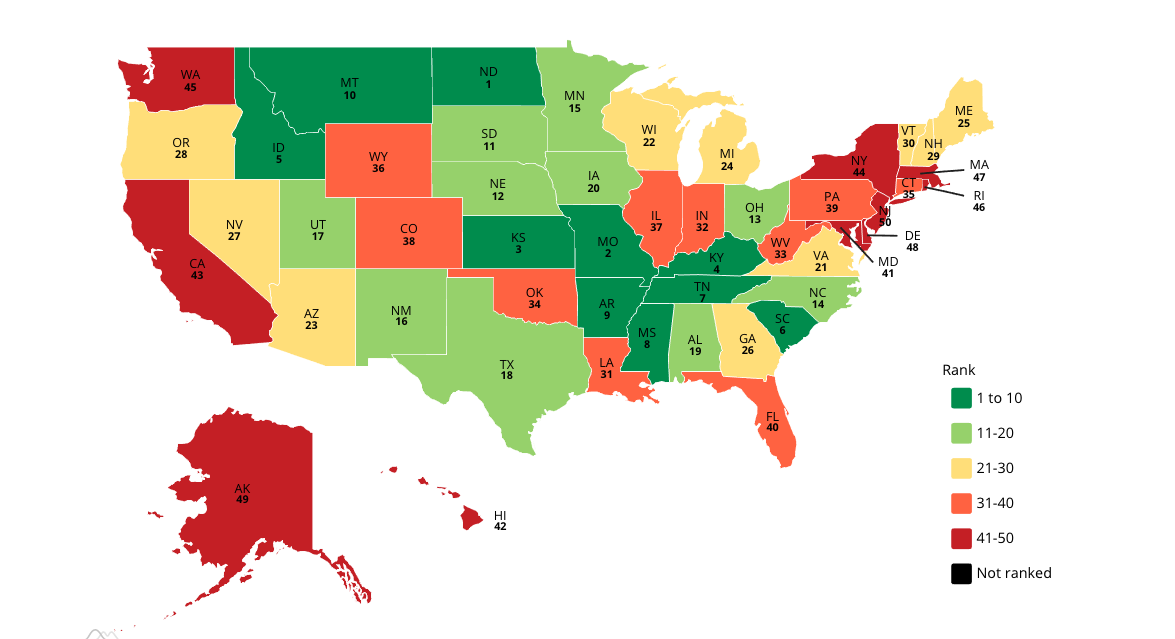
Below is the 2020 ranking.
“To improve in the rankings, Oklahoma needs to focus on improving its system quality. The state ranks in the bottom 15 of all states in three of the four disbursement measures and the bottom 10 in percent of structurally deficient bridges,” said Baruch Feigenbaum, lead author of the Annual Highway Report and senior managing director of transportation policy at Reason Foundation.
“Oklahoma is not in a high-cost environment. Considering what the state is spending, it should have much better quality infrastructure. As is, the state has average costs, poor pavement and bridge conditions, and a high fatality rate.”
Additional Analysis
Compared to nearby states, Oklahoma’s overall highway performance is better than Colorado (ranks 37th) but worse than Missouri (ranks 3rd) and Texas (ranks 16th).
Oklahoma is doing worse than comparable states like Kansas (ranks 7th) and Arkansas (ranks 17th).
Some states like North Dakota have very few categories in which they can improve. Others like New Hampshire are strong in some categories and weak in others. But no state ranks as poorly in as many categories as Oklahoma. On the other hand, Oklahoma’s lowest ranking is 45th.
As a result the state ranks far higher overall than New Jersey, which has seven categorical rankings in the bottom five. But Oklahoma needs to improve in every category. The best place to start is pavement and bridge condition. The state has far too many structurally deficient bridges, and pavement quality, particularly on rural highways, is poor. Becoming a top-20 state in pavement and bridge quality will help Oklahoma rise in the overall rankings.
Reason Foundation’s Annual Highway Report measures the condition and cost-effectiveness of state-controlled highways in 13 categories, including pavement condition, traffic congestion, structurally deficient bridges, traffic fatalities, and spending (capital, maintenance, administrative, total) per mile.
Oklahoma’s Rankings in the
26th Annual Highway Report
36
30
26
37
31
38
39
43
27
32
41
45
31
34